Superyacht Life Foundation executive director Dilan Saraç outlined the range of direct and indirect benefits flowing from the build and operation of superyachts.
Fleet usage accounts for 1/2 of the estimated €55 billion global benefit, bringing positive impacts to the localities in which superyachts operate as well as the nations in which they are built and maintained. Expressed another way, each of the sic thousand superyachts in operation around the world contributes €9 milion to the economy.
A study of the sector’s economic footprint
The study was commissioned by the Superyacht Life Foundation together with the Superyacht Builders Association to create the most accurate and scientifically grounded view of our sector’s economic footprint. For this, we brought together 2 complementary studies:
- Deloitte’s assessment of the direct economic impact;
- VU University Amsterdam’s modelling of the indirect and induced impact across the global superyacht ecosystem.
The research followed a rigorous, multi-step process that reflects best practice in economic analysis. It started with extensive data gathering across shipyards, refit facilities, service providers, and operational spending, followed by cross-checks, expert interviews, and the development of a detailed direct-impact model. VU University then applied input/output analysis to quantify wider economic effects, completing the study with additional expert validation and reporting.
A superyacht-specific input structure
VU’s Department of Spatial Economics applied input/output analysis, a well-established modelling framework that tracks how industries interact and how spending in one area ripples through supply chains and national economies.
Because of the scale and complexity of our sector, the team had to build a superyacht-specific input structure – something that has never existed before.
While this extended the timeline, it has given us a robust, repeatable model that will now allow us to evaluate the industry’s global economic contribution every year.
Direct and indirect impact
After months of validation and collaborative work, we can finally share a clear and scientifically grounded economic picture of our industry – one that I hope serves as your morning wake-up call and sets the tone for analytical, meaningful discussions throughout the day.
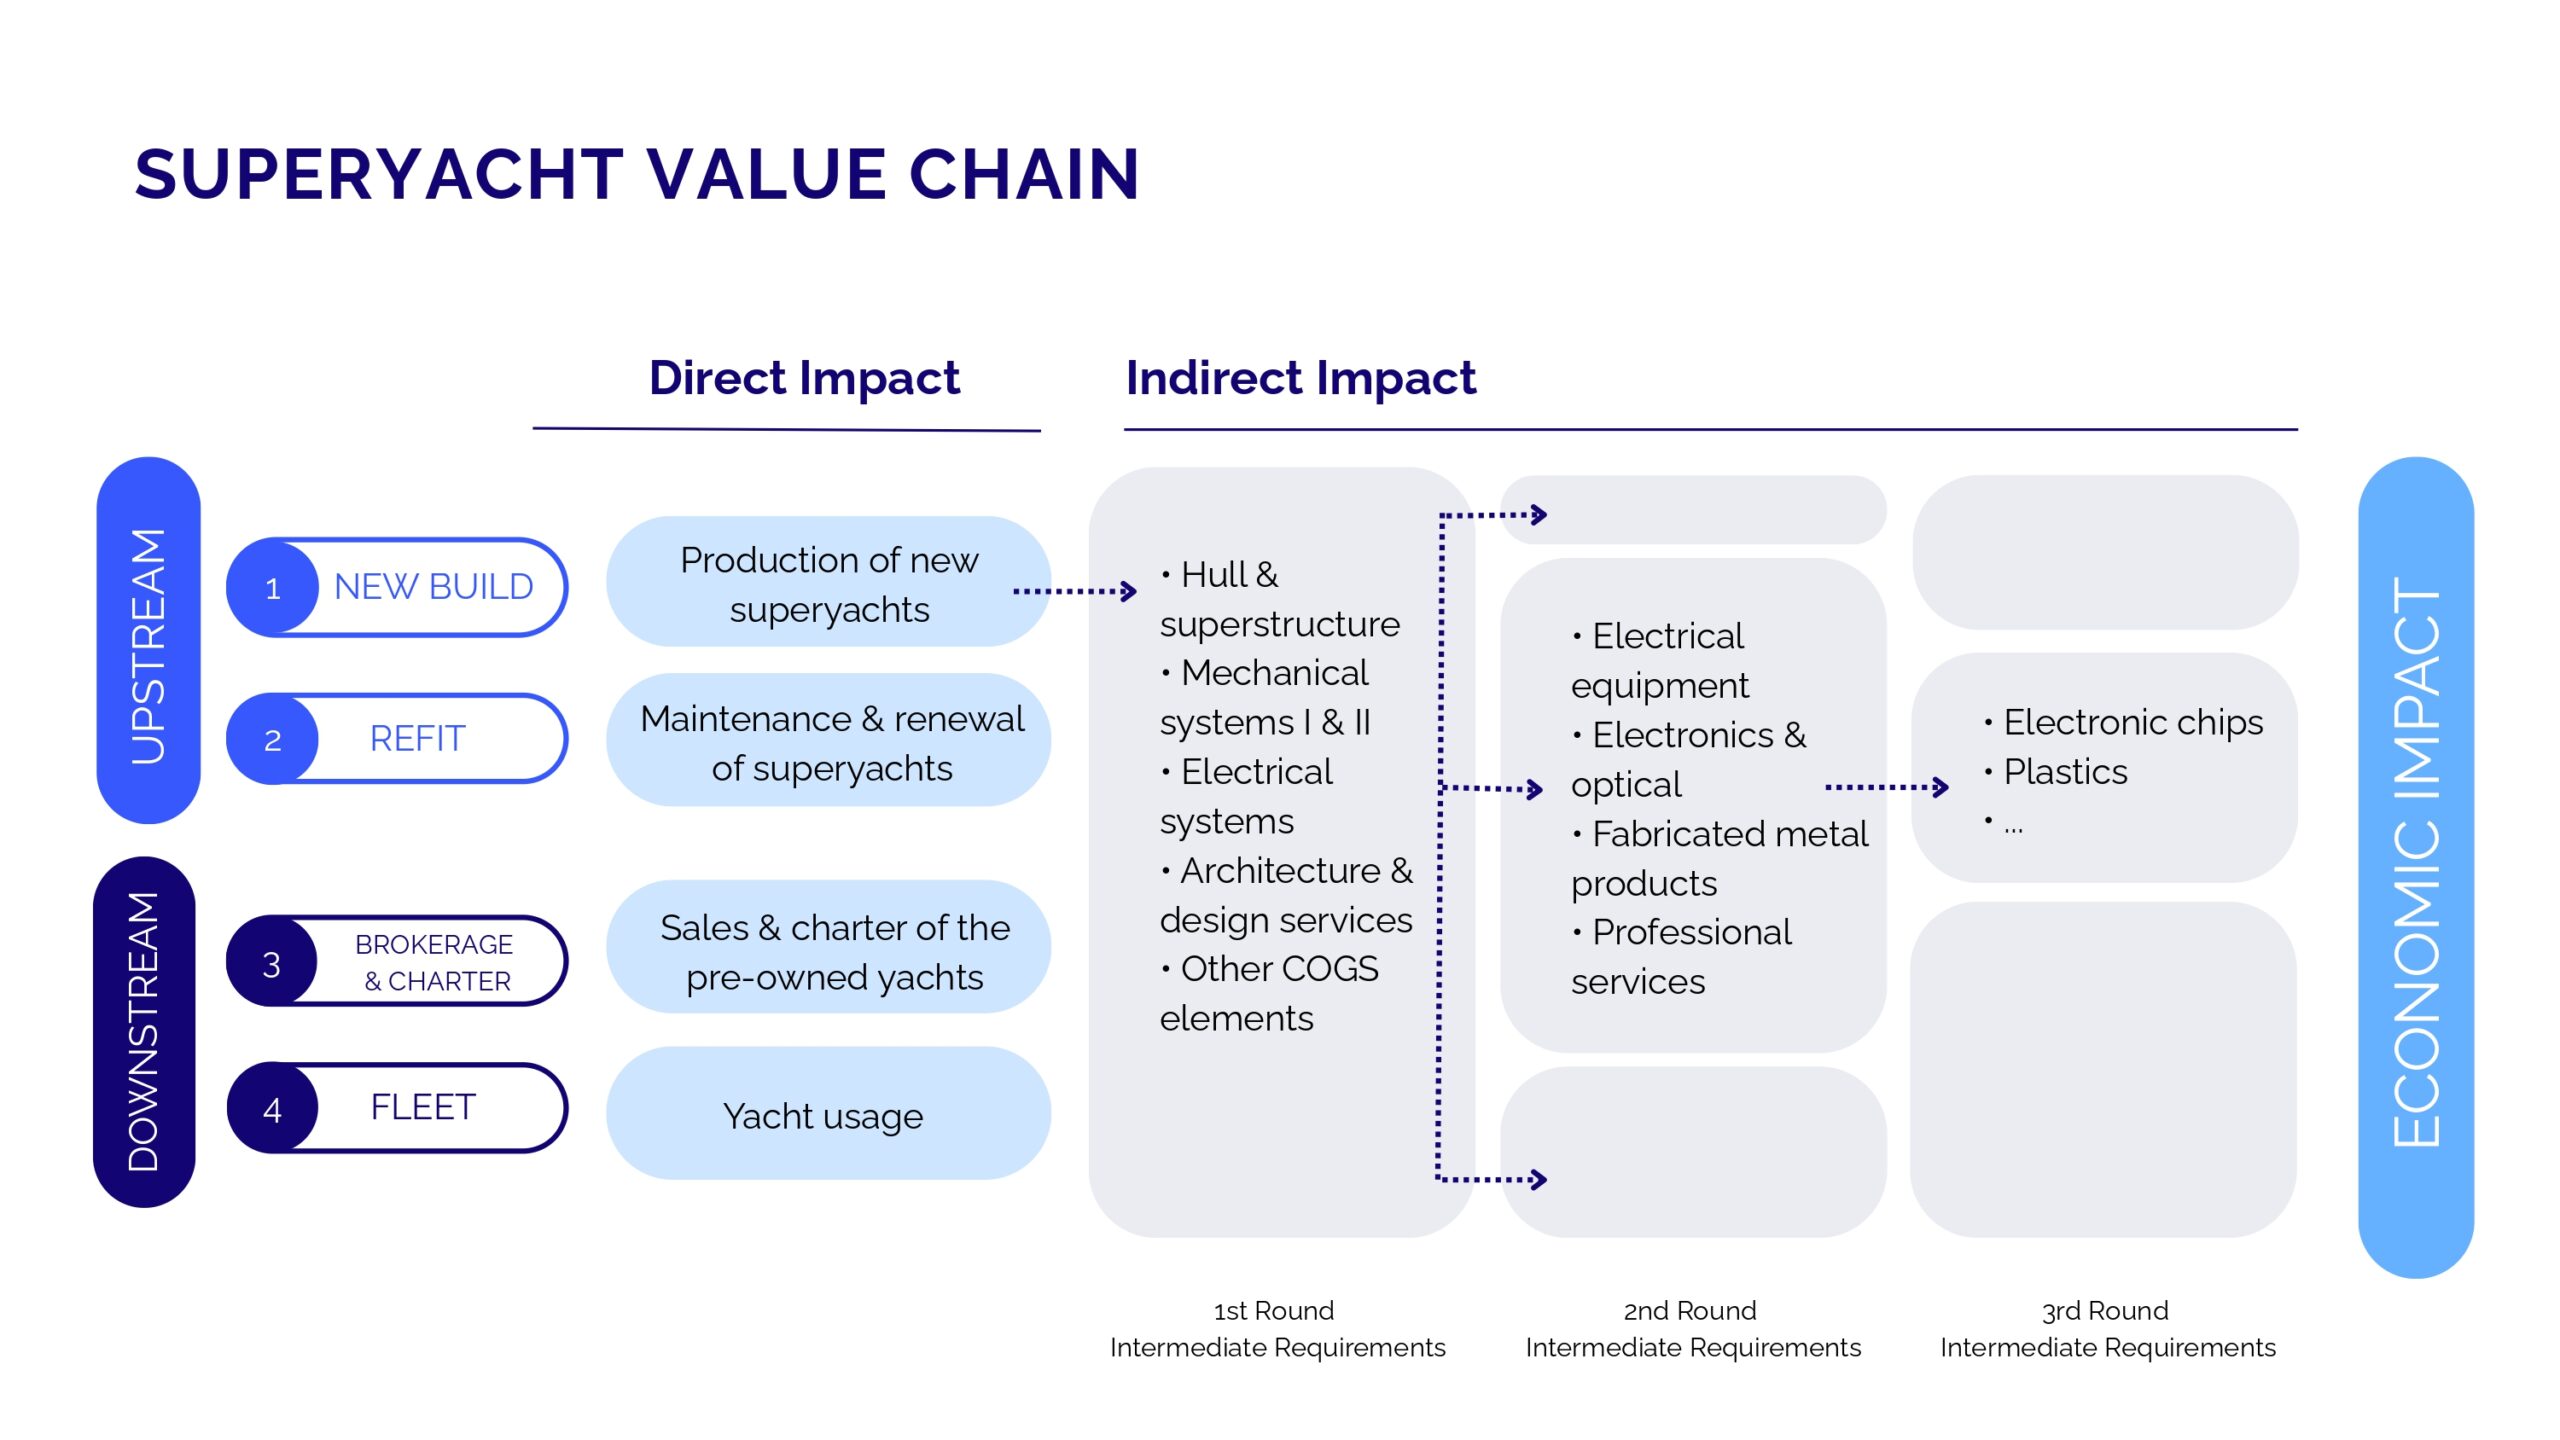
When we look at the superyacht value chain, we divide it into 2 sections: upstream and downstream. In the upstream part, we focus on new build and refit, which cover the production and maintenance side of superyachts. The downstream part looks at the brokerage and charter sectors, as well as the economic impact of fleet usage.
In picture 1 you see an example from the new build sector that shows how we define direct and indirect impact. Everything that is used directly for the superyachts themselves is counted as direct impact, while all the suppliers and service providers contributing to the new build are counted as indirect impact. Each segment of the value chain has its own clear definition of these impact types, and we will explore them one by one in a moment.
New Build
Looking to production value means the direct impact of top 5 countries, their average GT and overall length [picture 2]. Top 3 producers that are based on Europe hold around 80% of all new build production. Europe holds nearly 80% of all new build activity, but what’s even more impressive is Europe also covers different segment of the industry.
Italy leads with 37% of global production, focusing on yachts 40 m in average; The Netherlands follows with 23%, building yachts slightly larger – around 48 m. Germany, with 19%, specializes in the giants of the sea – vessels often over 100 meters and above 5,000 GT.
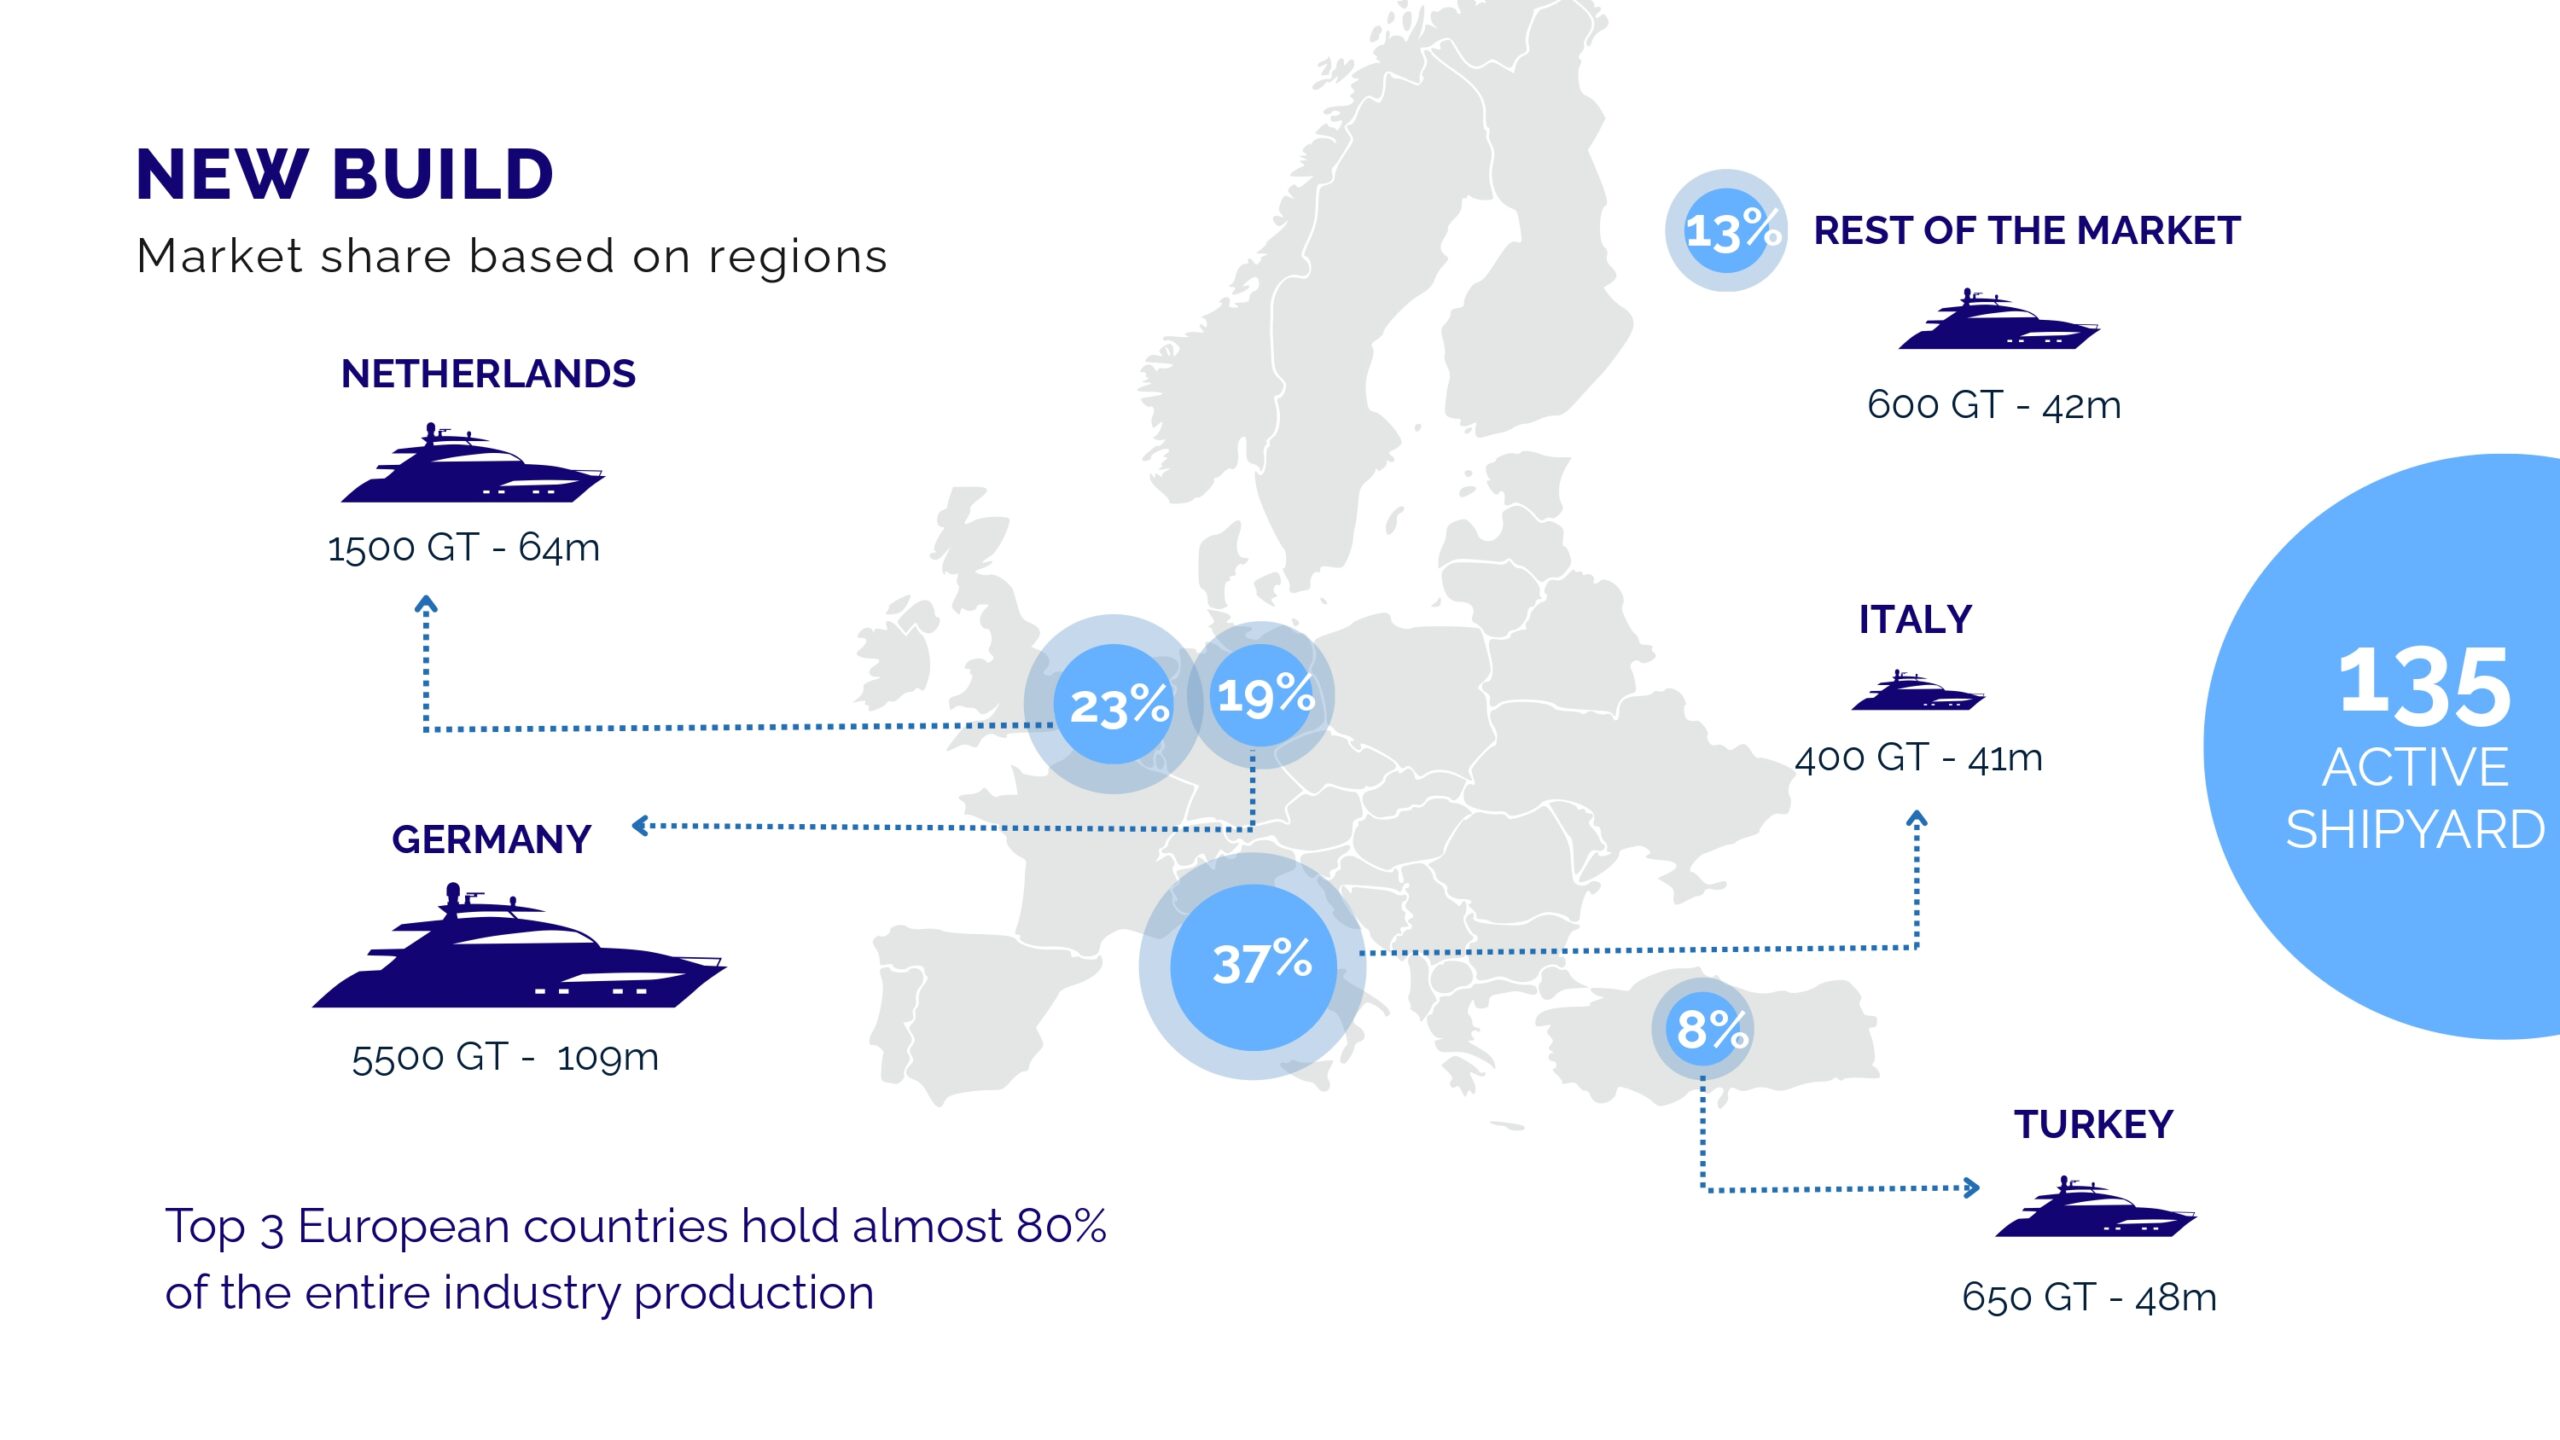
Turkey is gaining ground too, with strong capacity in the mid-range category. Together, these four countries cover every segment of superyacht production, reflecting Europe’s deep industrial diversity and strength”.
As per the total global economic impact of the new build, 221 superyachts were delivered in 2022, generating a direct economic impact of €7.2 billion and a total economic impact reaching €20 billion.
Every yacht, regardless of size, creates a ripple of high-value supply chain activity which is reflected in the total €20 billion economic footprint.
Refit
With €2.3 billion direct, and €3.3 billion indirect, the refit sector produces a total economic impact of €5.6 billion. Countries generating the most economic impact of the Refit sector in 2022 are, in order: USA, Italy, Netherlands, Turkey, France. What’s striking here is that nearly 70% of that value comes from indirect impact, highlighting how refit work drives an extensive ecosystem of suppliers, subcontractors, and service specialists.
Brokerage and charter
The first downstream sector that we will look into it is brokerage and charter. When we look at the breakdown by yacht size, brokerage commissions were highest in the 30-40 m range, reaching €114 million. Commission structure is around 10% for smaller yachts, tapering to 8% and 6% as yacht size increases. Charter commissions, however, show the opposite pattern – value rises sharply with size. Yachts over 60 m account for the largest share, with €118 million, compared to just €35 million in the 30-40 m range.
Across all segments, there were roughly 6,000 charter booking weeks, led by yachts between 30 and 50 m. Larger yachts, though fewer, contributed disproportionately in value due to higher daily rates. In total brokerage commissions count €278million direct impact, while charter commissions are very close to that amount with €250 million direct impact. Together, brokerage and charter create an essential bridge between ownership, operation, and economic circulation, keeping the fleet active and continuously generating value throughout the year.
Large charters
Charter penetration varies by yacht size, but the trend is clear: the larger the yacht, the higher the likelihood it’s available for charter. More than half of all 50-60 m yachts are chartered — the highest participation rate in the fleet. Even among yachts above 60 meters, nearly 40% are active in the charter market. 76% of the fleet is private owner 24%of the fleet is charter.
This balance between private and commercial use is key to the sector’s stability – keeping yachts operational, generating consistent employment, and supporting a broad network of charter managers, brokers, and service providers.
Fleet Operation
We then move onto the fleet which organically brings the findings about the Superyacht ownership that spans the globe: the data shows clear concentration among a few regions [picture 3]. The United States leads with 23% of all owners, followed by Russia with 9%. When we combine Greece, the UK, Italy, and other European nations, Europe accounts for more than one-third of total ownership.
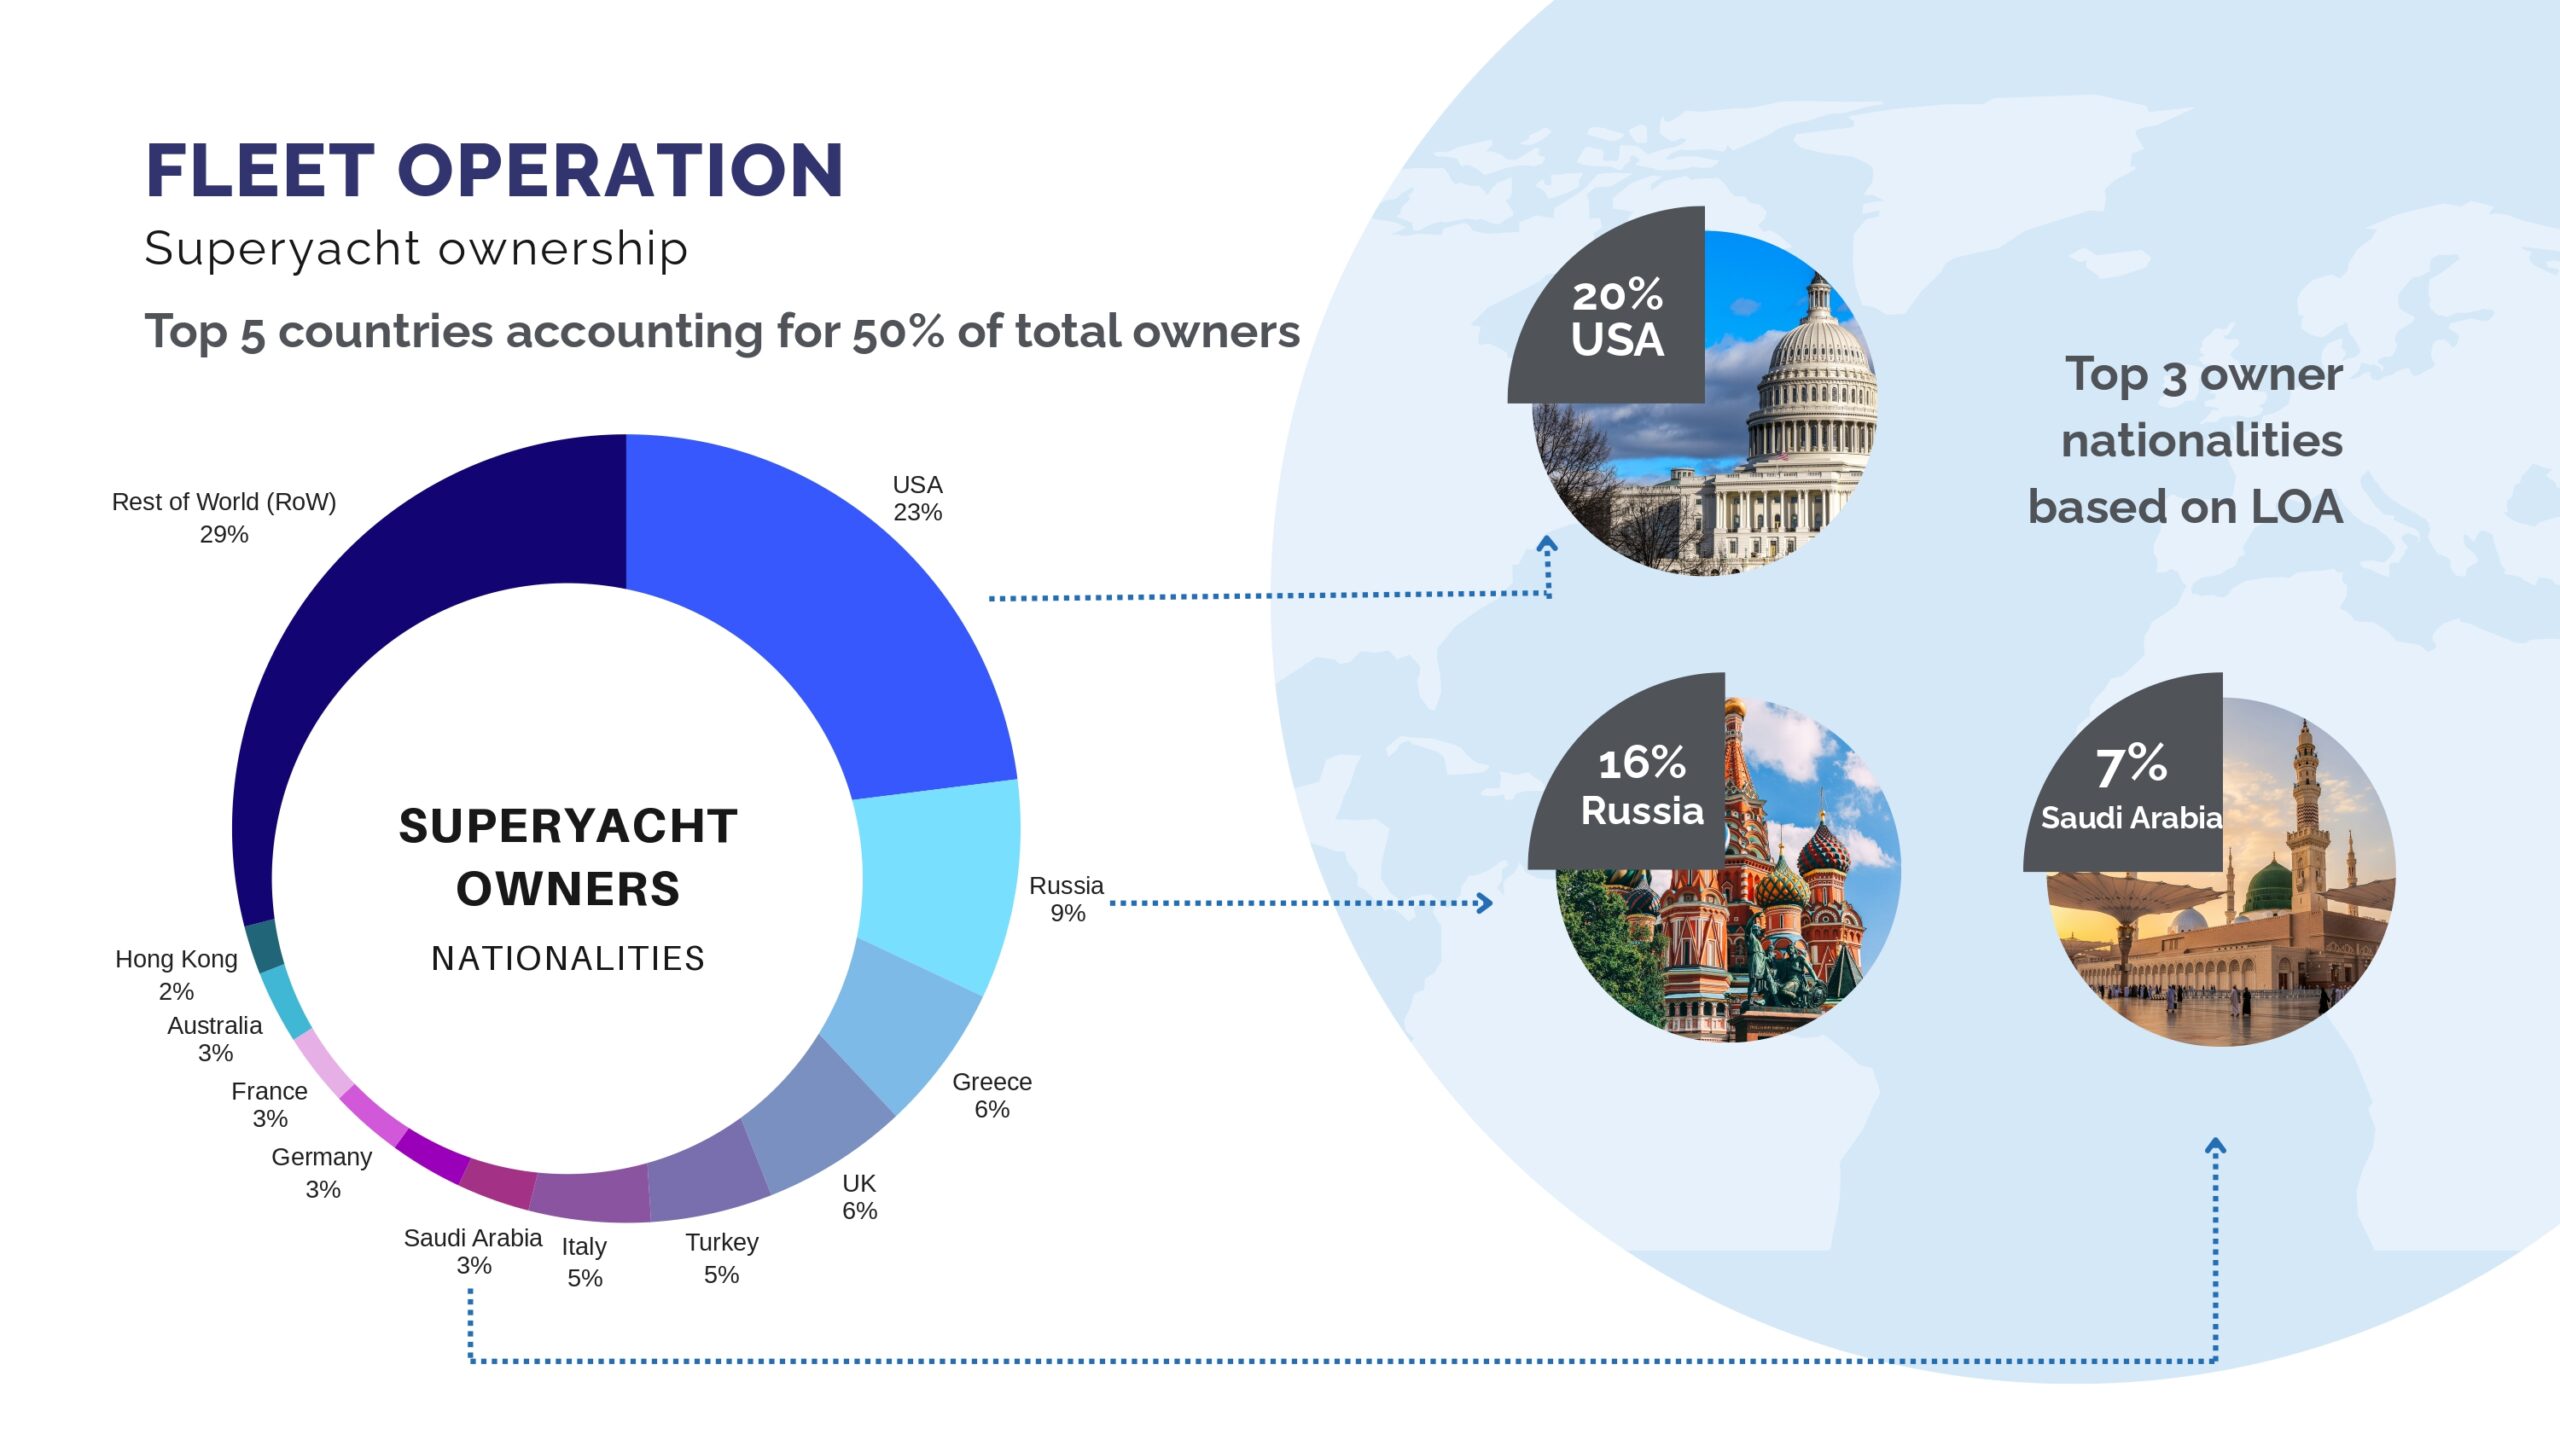
Overall, the top five countries make up half of all superyacht owners worldwide, reflecting both established markets and emerging hubs. This balance between traditional and new ownership regions is key to understanding where operational spending and investment flow.
A service-oriented structure
The operating structure of a superyacht is heavily service-oriented. The largest single cost category is crew, representing 37% of all operational spending (a clear indicator of the industry’s contribution to high-skill employment), followed by shipyard services with 20%, an after operating and administrative costs.
Fleet operation stands as the largest contributor to the superyacht industry’s economic footprint.
In 2022, it generated a direct impact of €12.1 billion consisting of 8.3B usage expenses and 3.8B owner expenses and an indirect impact of €15 billion, leading to a total of €27.1 billion. These figures show that once a yacht enters service, it becomes a long-term economic engine – sustaining continuous spending, employment, and regional development wherever it operates.

Key takeaways
With both upstream and downstream numbers, the study reaches to €54 billion total global economic impact for the superyacht industry.
The new build sector contributes €20 billion, representing 37% of total value. It is where the entire lifecycle begins, and its influence amplifies the impact of every other segment – making it a powerful engine of overall industry growth.
Refit contributes €5.6 billion, or 11% of the total, and represents one of the strongest future growth opportunities as the fleet continues to age.
Brokerage and charter generate €1.1 billion – around 2% of the total – and play a crucial role in keeping superyachts in a continuous cycle of reuse, activity and value generation.
Fleet usage is the largest contributor, accounting for €27 billion – 50% of total impact through Daily operations and tourism-related spending of the yachts.
Supporting a broader distribution of wealth
When we look at UHNWI consumption trends, their spending represents only a very small fraction of their wealth. A superyacht is one of the rare products – and our industry is one of the rare industries – where spending of UHNWI is substantial enough to generate a real, measurable impact on the wider economy, organically and strongly supporting a broader distribution of wealth.
On average, one superyacht generates €9 million in economic activity each year and supports around 60 jobs. We have more than 6,000 yachts in operation with long lifespans, and each one supports a broad economic ecosystem year after year. The data shows clearly how powerfully UHNWI spending fuels a genuine trickle-down effect.
Altogether, our industry generates a total economic impact that strengthening supply chains, driving innovation, and reminding us that every yacht, every project, and every person in this room contributes to a global ecosystem that keeps creating economic but also social value far beyond the water.